The coordination metrics that predict project outcomes and what elite BIM teams are measuring instead
Category: VDC Performance | BIM Coordination Metrics | Integrated Delivery | AEC Leadership
Most VDC Teams Are Measuring Activity. The Best Ones Are Measuring Outcomes.
In our previous blog, The Hidden Cost of Clash Report Overload in BIM, we made the case that clash detection is a QA step, not a coordination strategy. This blog takes that argument further.
Most VDC directors and BIM managers already sense it you can run a textbook coordination process, hit every milestone, and still walk into a site conflict that nobody saw coming. Not because the process failed, but because the metrics being used to evaluate it were never designed to surface the right signals in the first place.
Tracking clash counts tells you how many conflicts exist in the model at a given point in time. Tracking meeting frequency tells you how often teams meet in person. Tracking report volume tells you how much was found. None of these tells you whether your BIM coordination process is moving in the right direction and in high-stakes digital construction environments, that blind spot carries real cost. This is the measurement gap that DGTRA is built to close, giving VDC teams the outcome visibility they need to connect coordination activity to actual project performance.
This blog breaks down exactly what those teams are tracking and why each metric has a direct line to project outcomes.
Why Measurement Is the Missing Layer in Most BIM Coordination Workflows
Before getting into specific KPIs, it is worth understanding why most teams coordinate at high frequency but measure at low resolution.
Stanford’s Center for Integrated Facility Engineering identified metrics as one of the core tools within VDC — directly tied to continuous improvement across design quality, time, cost, and collaboration. Yet only a small number of academic papers have examined metrics specifically in VDC projects, a gap that mirrors what is happening on the ground.
Research across BIM and Lean Construction frameworks confirmed that the KPIs which actually reflect coordination effectiveness are cost efficiency, time savings, stakeholder collaboration, and process automation — not model completion or clash volume.
A study spanning NTNU and Stanford’s VDC Certificate Program identified 35 performance metrics across six design management control areas and found that the most valuable ones measure decision-making velocity and coordination readiness — not output volume.
BIM coordination performance is measurable in ways that surface delivery risk long before the site does. The teams doing this well are not just better at coordination — they have visibility into whether it is working.
Here is what they are tracking.
The 6 KPIs Leading VDC Teams Are Tracking in 2026
KPI 1 — Decision Velocity

What it measures: Average time from a coordination conflict being identified to a documented, approved resolution.
Most teams track how many clashes are open. High-performing VDC teams track how long decisions take. A model with 50 unresolved clashes and a 48-hour decision cycle is in a far stronger position than one with 20 clashes and a 14-day resolution cycle. Research published in Scientific Reports found that structured BIM coordination workflows reduce coordination cycle time to 1–2 days — significantly faster than BIM-only approaches averaging 5–7 days — with the reduction directly tied to integrated decision-making structures and standardized data governance.
KPI 2 — Coordination Readiness Score

What it measures: Percentage of interface zones with confirmed ownership, agreed LOD, and documented coordination agreements — measured at the start of each milestone, not the end.
This is the upstream metric most teams have never defined — and the most predictive indicator of whether a coordination phase runs proactively or reactively. Research in Frontiers in Built Environment found that design coordination ranked highest among BIM functionalities with a Significance Index of 90% — and that structured coordination ownership frameworks delivered an 80% reduction in design-related change orders.
KPI 3 — Interface Resolution Rate

What it measures: Percentage of coordination items reaching full resolution — documented decision, updated model, confirmed sign-off — within a single review cycle.
Research published in Discover Materials found that the strongest rework reductions — 40–50% — occur specifically in projects where coordination items are tracked to full resolution within structured review cycles rather than carried across multiple meetings. United-BIM This metric tells you whether coordination is moving forward or building technical debt that lands on site.
KPI 4 — LOD Alignment Index
What it measures: The degree to which all disciplines are modeling at consistent, agreed LOD levels at each coordination milestone.
A federated model where one discipline is at LOD 350 and another at LOD 200 produces clash reports that look clean — and fail the moment the lower-LOD discipline develops further. Research in the KSCE Journal of Civil Engineering found that increasing LOD and information integration by even one usage level produces measurable improvements in design satisfaction, cost variance, and delivery outcomes.
KPI 5 — Site Trust Index
What it measures: Percentage of coordination decisions requiring no revision or clarification after reaching the construction team — tracked per discipline and per zone.
Sign-off rate tells you someone approved the model. Site Trust Index tells you whether it held up on site. Research in Scientific Reports found that ISO 19650-aligned BIM coordination reduced pipeline dismantling rates — systems requiring removal and reinstallation due to spatial conflicts — by 22–35% compared to traditional approaches, directly linking upstream coordination quality to site execution accuracy.
KPI 6 — Coordination Cost per Resolved Item
What it measures: Total coordination resource cost — time, meetings, rework cycles — divided by items reaching full resolution per review cycle.
This is the metric that makes the ROI case for upstream coordination investment most clearly. A 2025 case study of a Performing Arts Center found that a structured BIM coordination workflow reduced total coordination time by 40% — with gains attributed directly to proactive digital resolution before construction began, rather than reactive on-site correction. Teams investing in Shared Modeling Intent consistently see this number improve from cycle one.
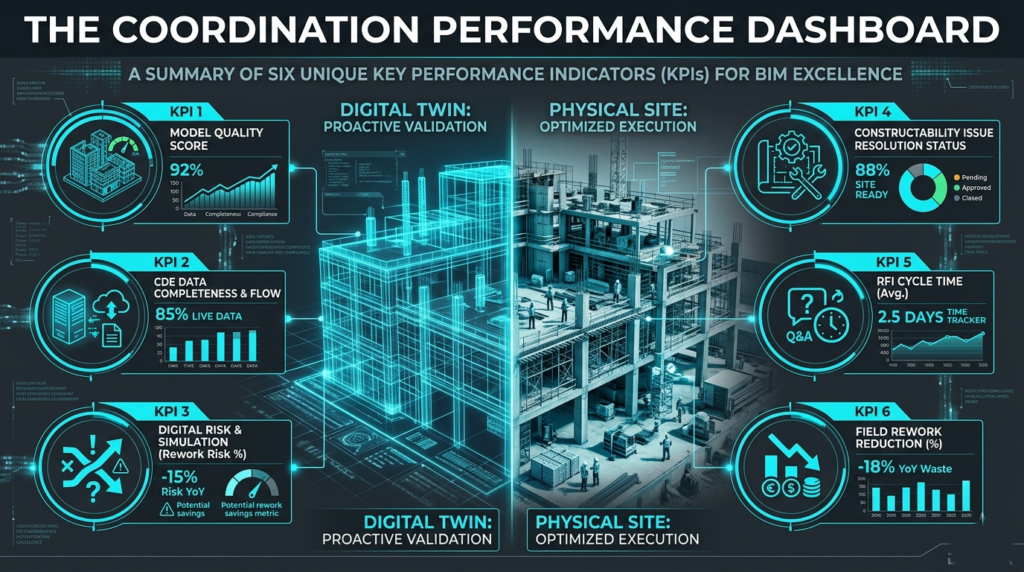
How These KPIs Work Together — The Coordination Performance Dashboard
The power of these six metrics is not in tracking them individually. It is in reading them as a system.
Decision Velocity + Interface Resolution Rate = how fast your coordination engine is running and whether it is accelerating.
Coordination Readiness Score + LOD Alignment Index = how well-prepared your disciplines are before coordination begins — the upstream health indicators.
Site Trust Index + Coordination Cost per Resolved Item = the downstream proof that upstream coordination investment is delivering real project value.
A VDC director reviewing these six metrics weekly has a fundamentally different level of visibility into delivery health than one reviewing clash counts and meeting attendance. They can see whether the coordination process is improving before it is too late to change course — and they can make the case to project leadership with data, not anecdotes.
DGTRA’s BIM Management Projects service embeds this measurement framework into live project delivery — giving VDC and BIM teams the visibility infrastructure that makes continuous coordination improvement possible from day one.
Building the Measurement Culture — What It Actually Takes
Tracking these KPIs requires more than a dashboard. It requires a coordination culture where measurement is built into the process — not bolted on afterward.
Three things make the difference:
Ownership at the metric level. Every KPI needs a named person responsible for tracking it and acting on what it shows. Metrics without owners become vanity data.
Defined thresholds and escalation paths. Each metric needs a floor — a level below which the coordination process pauses and the issue is escalated. Without thresholds, tracking becomes observation without action.
A feedback loop from site to model. The Site Trust Index only works if the construction team has a structured channel for reporting coordination revisions back to the VDC team. Closing that loop is what transforms site feedback into coordination intelligence.
Research on VDC performance metrics emphasizes that the key to a functional measurement system is acceptance and understanding across the project team — and that metrics must be tied directly to controllable factors so that teams know not just what is being measured but what specific actions will move the number.
DGTRA’s Strategic BIM Roadmap service helps organizations build exactly this infrastructure — embedding measurement discipline into the coordination process before delivery begins so teams are improving from day one rather than month six.
The Measurement Advantage Is Available to Every VDC Team Right Now
The six KPIs in this blog do not require new software. They do not require a larger team. They require a decision — to measure what actually matters rather than what is easiest to count.
And that decision, made before your next project kicks off, compounds across every coordination cycle, every milestone, and every site handover going forward.
The VDC teams pulling ahead in 2026 are not running more detection. They are running smarter coordination — and they can prove it with data.
Your team has the same capability. The measurement framework built around it is what makes the difference visible.
Frequently Asked Questions